Finding Dominant Colours in Images 6 October, 2015
A colleague recently shared a link to Charles Leifer's blog post on finding dominant colours in images and mentioned it was something he'd like to eventually integrate into our own product at some time. K-Means clustering is something I have a vague familiarity with but isn't something I've personally implemented before so with a spare day over the weekend I figured I'd give it a shot.
If you don't have an background in algorithms reading about K-Means clustering will lead you to all sorts of Greek letters and mathematical symbols which may be a little confusing but the actual algorithm is surprisingly straight forward. If you just want to dive straight into the code have a look at my code samples repository which has a simple implementation. Otherwise, stick with me.
If you're not familiar with this idea it might help to start with a few examples. Below are three examples produced via the code linked above. In each of them the bottom of the image has three colour swatches which are the k means clusters (in this example, k is 3).
Examples

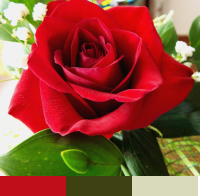
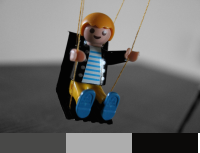
I think looking at these three sample images (all from the Morgue File Project and free for use) highlights some interesting aspects of the algorithm. The coffee and rose images swatches both look like what your, or at least, my expectation of the dominant colours are in these images. The plastic figurine image isn't what I initially expected and this gets into the difference between perceived dominance and statistical colour dominance. Looking at this image the light and dark grey and the black are indeed the most common colours in the image but they're not the one your eyes are drawn to. You immediately notice the blue of the figures shoes and shirt, yellow pants and ginger hair. However the statistical commonality of these colours is rather low (and their variance from each other would mute their affect on the algorithm). If you are looking for something to get this highlight colour out there's a few things you could do which I'll discuss later.
Algorithm
Now the actual algorithm;
- Collect your data. Here I'm using .Net's
Imageclass to load the pixel data - Determine a set of
kinitial clusters for your data - For each pixel in your image determine the colour's Euclidean distance to its nearest cluster
- Recalculate the centre of each cluster based on the colours in the cluster
- If the centre of any of the clusters changed, clear the clusters and go back to 2.
0. Collect your data
This is pretty straightforward. You want to load all of the pixels colours of your image into memory. If you look at Program.cs I'm doing this very naively through a call to Image::GetPixel(). It's not terribly performant but you'll find that the calculation of the k means will likely take much longer than your repeated calls to Image::GetPixel(). One thing that is worth optimising however is the amount of data you load; if you've taken a quick snapshot with your phone's 8 MegaPixel camera you're not going to need all 8 million pixels. It's worth resizing the image down to something more mangeable. I've had good results with images with a maximum dimension of 75pixels but it will depend on the complexity of your images. Full colour photographs will work better with more pixels as compared to simple logos or drawings. A maximum image dimension of 200 pixels seems to be a good balance between results and speed.
1. Determine a set of k initial clusters
The first real part of the algorith is to determine your initial k clusters. Remember that k is how many dominant colours you want out of your image. There's two approaches to determining your initial clusters; The Forgy Method and Random Initialisation. Random Initialisation actually yields excellent results in most cases and it's really easy to implement. You just pick k random colours from your list. Their positioning in pixel space doesn't matter (infact you can discard the pixel coordinates completely it's only colour space you require). Psuedo-C# for this phase is really straight forward;
List<Color> colors = GetSourceData();
Random r = new Random();

for (int i = 0; i < k; i++) {
  int index = r.Next(0, colors.Count);
  AddInitialCluster(colors[index]);
}
The actual implementation can be found in KMeansClusteringCalculator.cs
2. Determine Euclidean Distance to nearest Cluster
Euclidean distance, sometimes known as Cartesian or Pythagorean distance, is the square root of the sum of the square differences between vector components. Obviously. To put this another way we can think of our Color as representing a point in 3-dimensional colour space (Instead of an X, Y and Z axis we have a Red, Green and Blue axis). So blue would be at position (0, 0, 255) whilst red would be at (255, 0, 0). And the Euclidiean distance between the two could be calculated with;
private double GetEuclideanDistance(Color c1, Color c2) {
    return Math.Sqrt(
        Math.Pow(c1.R - c2.R, 2) + Math.Pow(c1.G - c2.G, 2) + Math.Pow(c1.B - c2.B, 2)
    );
}
The actual implementation of this can be found in KCluster.cs.
Now that we know how to calculate the Euclidean distance between two colours it's a simple matter of comparing the distance for each colour to each of our clusters and adding it to the closest one.
var clusterList = GetClusterList();

for (Color color in colors) {
    int indexOfNearestCluster = -1;
    double distanceToNearestCluster = double.MaxValue;

    for (int i = 0; i < clusterList.Length; i++) {
        double distance = GetEuclideanDistance(clusterList[i].Centre, color);
        if (distance < nearestCluster) {
            indexOfNearestCluster = i;
            distanceToNearestCluster = distance;
        }
    }

    clusterList[indexOfNearestCluster].AddColour(color);
}
The important thing to note here is that clusterList is a list of some kind of data structure which contains the property Centre which is, for the first pass, the random colour we came up with in Step 1. Over subsequent iterations this value will be updated. So, once we find the nearest cluster we want to add the colour we're currently working on to that cluster. This is important for our next step. Again, this is only pseudo-C#, and the actual implementation can be found in KMeansClusteringCalculator.cs.
3. Recalculate the cluster centre
Like calculcating the Euclidean distance this is again something that looks a lot more intimidating than it is. If you look at Wikipedia you'll see a wonderfully confusing expression;

But this is actually rather straight forward; for each vector component (ie. red, green and blue) you take the average of that colour component in the cluster.
List<Color> colorsInCluster = GetColoursInCluster();
float r = 0;
float g = 0;
float b = 0;

foreach (Color color in coloursInCluster) {
    r += color.R;
    g += color.G;
    b += color.B;
}

Color updatedCentre = Color.FromArgb(
    (int)Math.Round(r / colorsInCluster.Count),
    (int)Math.Round(g / colorsInCluster.Count),
    (int)Math.Round(b / colorsInCluster.Count)
);
It's actually really simple. You can find the actual implementation in KCluster.cs.
4. Check for Cluster Centre Changes
This is pretty easy, actually, you take the original centre for each cluster and compute its Euclidiean distance to the new centre. If all of the distances between the old and new centres is below some threshold (or zero) you consider the algorithm complete. The new centres for each of your clusters are the dominant colours in your image. However if any of the centres have moved more than the threshold then you need to empty all of the clusters and start again from Step 2. Now however instead of computing each colour's distance to the randomly selected colour you are instead comparing it to the recalculated cluster centre. You can see this loop in KMeansClusteringCalculator.cs
Finally...
As I mentioned earlier looking at the plastic figurine image the dominant colours aren't those your eye are immediately drawn to. What you can do here is filter the data you provide for Step 0. The question is what filtering do you provide? In our figurine example the issue is that there's a lot of blacks, greys and whites all of which are rather boring. So we probably want to filter those colours out. But how? If you simply filter anything that is, for example, RGB(0, 0, 0) out it won't catch RGB(0, 0, 1) or RGB(1, 1, 1) which most people would percieve as black. What we want is some kind of way of determining the distance a colour is from black, grey and white.... like, say, our Euclidean distance from earlier. You'll want to play aroud with exact figures but I found that any colour that has a Euclidean distance of more than 200 from solid black and solid white works rather well.
List<Color> filtered = GetSourceData()
                        .Where(c => (KCluster.EuclideanDistance(c, Color.Black) >= 200) && (KCluster.EuclideanDistance(c, Color.White) >= 200))
                        .ToList();
After such a filter has been applied you'll end up with images more like...

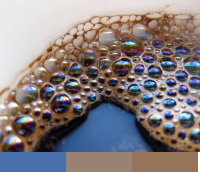

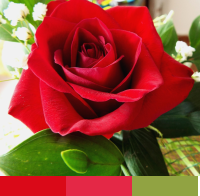

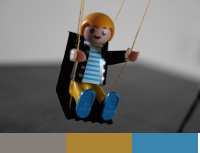
This produces excellent, eye catching, results for our plastic figurine. But notice now the most dominant colour on the coffee is the blue colour from the oil sheen? It's worthwhile playing with these threshold values to see what produces the appropriate output for your use case.
All of the source is available in my code-samples repository on GitHub. When running the code you can point it to a single file or a directory full of images. It'll produce the k means cluster for those images, output to the console, and then produce a .output.png file which contains the swatches used throughout this post.